If you haven’t read Part 1 of this blog article, please read it here. If you have, then let’s continue. Below I’ll take you step-by-step through the remaining portion of the top 10 chart patterns for trading, explain what they are, why they matter, how to trade them, and include real stock market context so you can relate the theory to what you’ll see on actual charts.
Top 10 Chart Patterns – 5 through 10
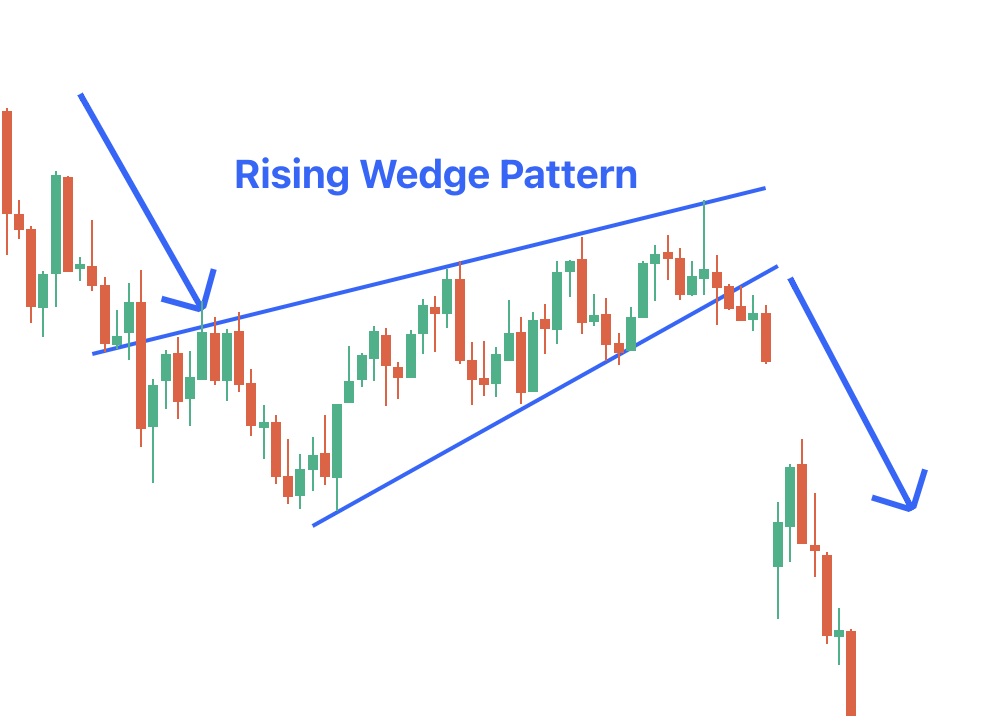
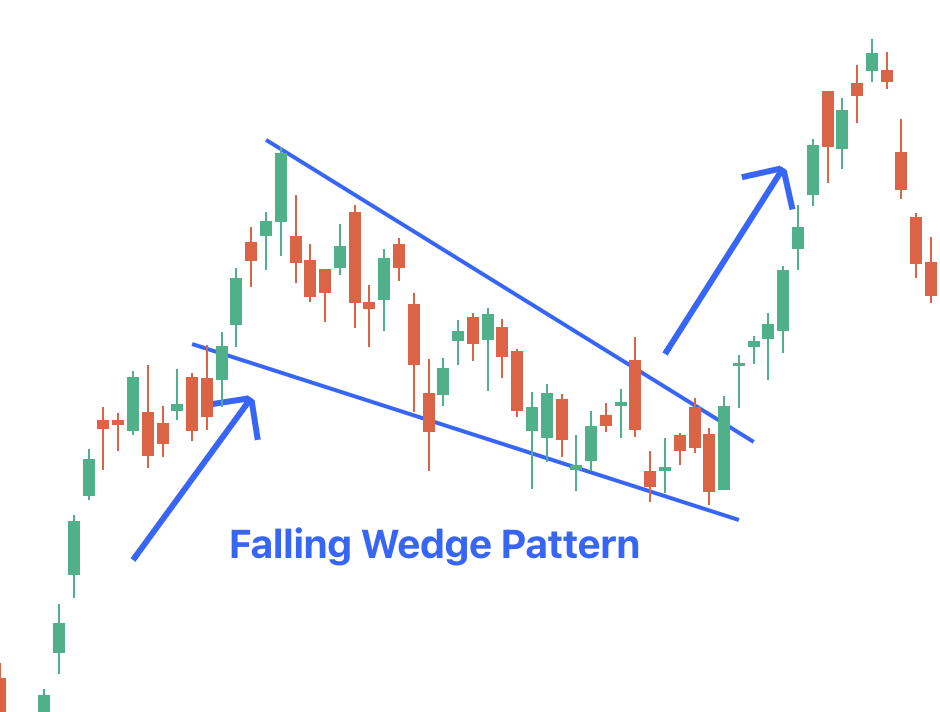
6. Wedge (Rising Wedge / Falling Wedge) Chart Pattern
What it is:
Rising Wedge: Both support and resistance slopes upward, but support slopes steeper so range narrows → usually bearish reversal or breakdown.
Falling Wedge: Both slopes downward, resistance slopes more steep → bullish reversal or breakout.
How to trade it:
Identify wedge shape after trend or consolidation.
Entry at breakout (below support for rising wedge; above resistance for falling wedge).
Volume typically decreases as wedge forms, then increases at breakout.
Stop-loss just inside wedge.
Target = height of wedge at its widest part projected from breakout.
Stock Tip:
Wedges are less obvious than triangles but show in many stocks during consolidation phases. Always check breakout direction with volume and market context.
Nuance: Rising wedge in up-trend can be more risky because breakdown may trigger sharper fall; handle aggressively.
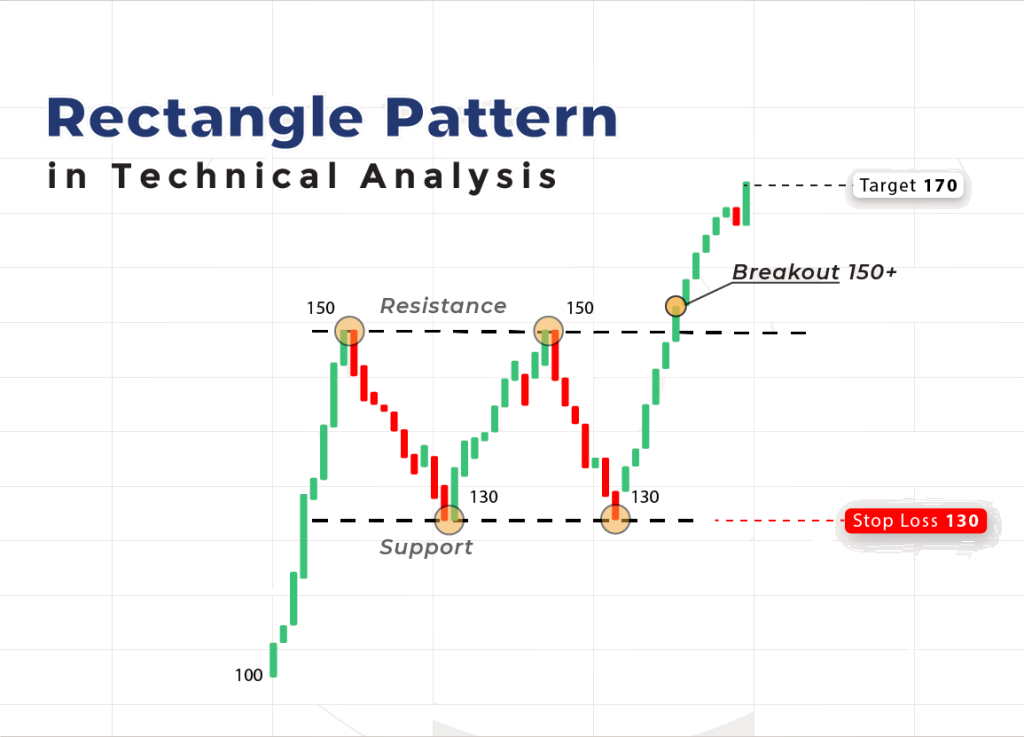
7. Rectangle or Trading Range (Sideways Consolidation)
What it is:
Price moves between fairly horizontal support and resistance levels for some time (box shape) → then price breaks out or down. This can be continuation or reversal depending on context.
How to trade it:
Identify clear horizontal boundaries (support + resistance).
Wait for breakout or breakdown above/below those levels with volume.
Entry after breakout; retest of breakout boundary offers lower-risk entry.
Stop-loss just inside the range (or below/above breakout).
Target = height of rectangle projected from breakout.
Stock Tip:
Many stocks spend weeks/months in ranges before trending. Range-break trades are popular for swing trading when trend is absent. But watch false breakouts.
Nuance: Because range breaks can fail (fake-outs), confirm with volume and be selective. A breakout without volume spike is less reliable.
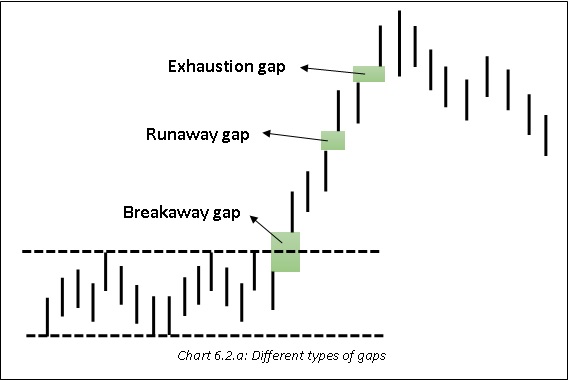
8. Bullish/Bearish Gap Chart Patterns
What it is:
A gap occurs when price opens significantly above or below previous close, leaving a “gap” in chart. Depending on where it occurs (after trend, at exhaustion etc.) it can signal strong moves.
How to trade it:
Identify gap type: breakaway (start of move), runaway/continuation, exhaustion (end of move).
For a breakaway gap: entry when price confirms above gap with volume.
Stop-loss often below gap.
Target depends on pattern; often height of prior trend, or measured by other patterns.
Stock Tip:
When a stock releases very strong quarterly results, opens with gap up and then rallies, this sets a potential gap-break setup. But gap-fills (price returning to fill gap) must be considered in risk management.
Nuance: Gaps are more powerful when volume is high and when sector/market momentum supports. However, gaps can also trap traders (false breakout). Use with caution.
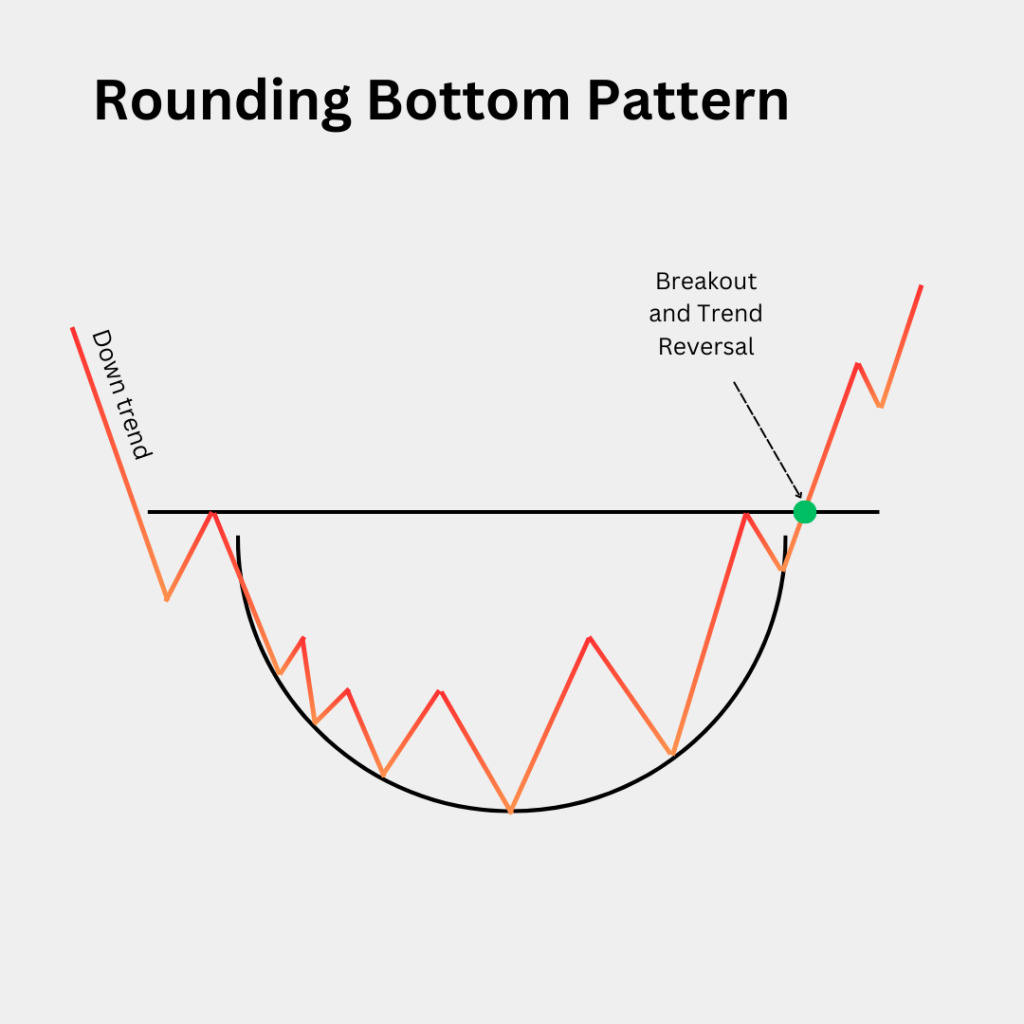
9. Rounding Bottom / Saucer Bottom Chart Pattern
What it is:
A long-term base formation where price gradually curves down then up, forming a “U” shape. Signifies accumulation, shift from down-trend to up-trend.
How to trade it:
Recognise extended period of decline/sideways, followed by a gradual rounding.
Entry once price breaks above the rim of the rounding base, ideally with volume.
Stop-loss below the rim or low of base.
Target: depth of the base added to breakout price.
Stock Tip:
In stock markets, mid-cap stocks often form rounding bases over months. When breakout occurs, they give good swing/trend trades. Combine with fundamentals for higher conviction.
Nuance: Patience is critical. The rounding base may last many months. Traders must withstand being ‘boring’ until breakout. Time-horizon must suit you.
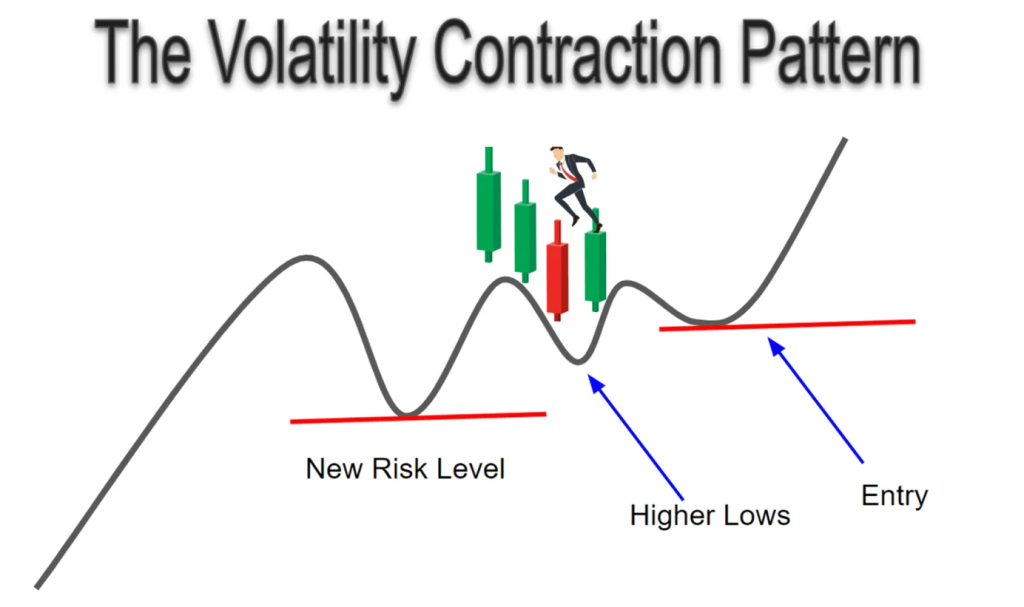
10. Volume-Contraction / Volatility-Contraction Chart Patterns (VCP-Style)
What it is:
Price swings gradually narrow over time, volume reduces; then a breakout occurs with volume expansion. Popularized by traders like Mark Minervini (though in US markets) but applicable in Indian markets too.
How to trade it:
Look for a prior strong move up (or down), then a tightened consolidation: smaller swings, lower volume.
Entry when breakout occurs with volume uptick.
Stop-loss just inside consolidation.
Target based on breakout momentum and structural levels (rather than fixed geometry).
Stock tip:
For stocks, this kind of pattern shows up when the market “goes quiet” after a run-up and smart money accumulates quietly. A breakout shows up as sudden volume + price move. Good for swing trading.
Nuance: Because the geometry is less rigid than classical patterns, your judgement rule is key: the tighter the contraction and volume fall, the stronger the potential breakout. But false breaks exist. Use stop-loss strictly.
Unique Insights
Pattern quality matters</strong>: All the top 10 chart patterns are obviously not equal. A triangle that lasts 3 months with shrinking volume is stronger than one that lasts a week with wild swings.
Volume is the truth-meter: Especially in Indian markets, where many retail traders may enter too early, look for genuine volume spikes on breakout. A breakout on low volume often fails.
Timeframe adapts to your trading style: If you’re a swing–trader (holding days to weeks), use daily charts. If you’re positional (weeks to months), also look at weekly charts. Patterns on weekly charts tend to be more reliable but less common.
Combine with other tools: Patterns alone don’t guarantee success. Use support/resistance zones, moving-averages, RSI/MACD for confirmation. For instance, if breakout occurs and RSI already over-extended, the risk might be higher.
Risk management is non-negotiable: Even textbook patterns fail sometimes. Always protect your capital. A well-managed small loss is far better than a large unexpected one.
Market nuances: Liquidity, surprise policy announcements, stock-specific news, and sector sentiment can affect pattern reliability. Be aware of broader market context.
Final Words
Mastering trading chart patterns gives you a visual toolkit to read what the price is doing and what it might do next. For beginners especially, it helps move beyond guessing and into structured setups.
From the top 10 chart patterns above and in the previous blog —Double Tops/Bottoms, H&S, Triangles, Flags/Pennants, Cup & Handle, Wedges, Rectangles, Gaps, Rounding Bottoms, and Volume-Contraction—you have a broad set of tools. Use them responsibly, always tie them with volume + context + risk management.
With time, your eye will start spotting good patterns in the stock market quickly, and you’ll develop confidence in entering, managing and exiting trades.