If you’re trading the markets, it’s smart to get familiar with the core chart patterns. These are like sign-posts on a map: they hint at what price might do next. When linked with risk management and good setup discipline, they can help build a second income stream from trading.
Below I’ll take you step-by-step through 10 important chart patterns for trading, explain what they are, why they matter, how to trade them, and include real stock market context so you can relate the theory to what you’ll see on actual charts.
What Are Chart Patterns, and Why They Matter
In simplest terms: a chart pattern is a shape or formation on a price chart that recurs often enough that traders believe it signals a likely future move. These formations are built by price action + volume.
These patterns fall into big categories:
Reversal patterns: indicate the current trend may end and reverse.
Continuation patterns: indicate the current trend will pause and then resume.
Bilateral/Neutral patterns: might break out either way.
Why bother? Because if you learn to identify them, you can:
Choose entries when the pattern confirms (breakout or breakdown)
Set stop-losses at logical invalidation points (e.g., outside the pattern)
Set targets based on pattern geometry (height, width)
Avoid trades where the pattern is weak or volume is missing
The 10 Patterns: What They Are & How to Trade Them
1. Double Top / Double Bottom
What it is:
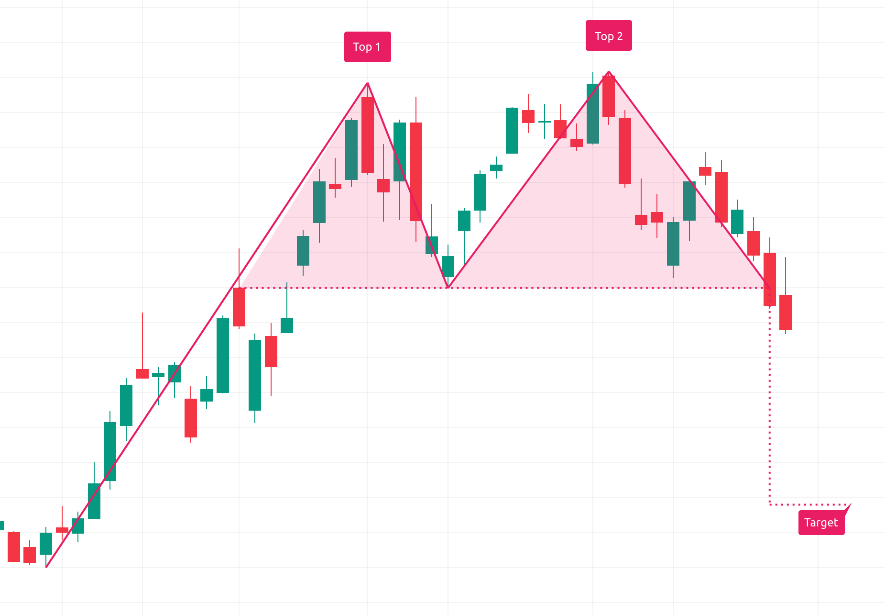
Double Top is a reversal pattern of an up-trend: price hits a high, pulls back, comes up again to roughly the same high, then falls below the pullback point (“neckline”) → signals a trend change down.
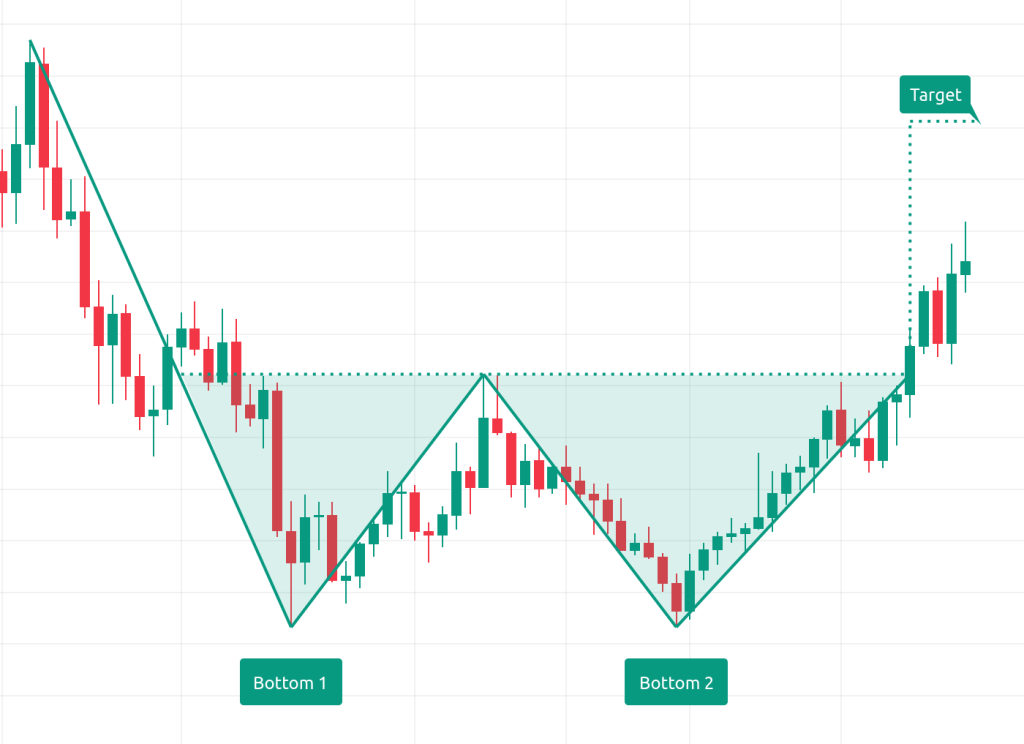
Double Bottom is the mirror image in a down-trend.
How to trade it:
Wait for the neckline break with increased volume.
Entry around breakout/breakdown.
Stop-loss above second top (for double top) or below second bottom (for double bottom).
Target = height of the pattern from neckline to top/bottom, projected downward/upward.
Key nuance: Beware of “false breakdown” where price returns above neckline quickly — check volume.
2. Head and Shoulders / Inverse Head and Shoulders
What it is:
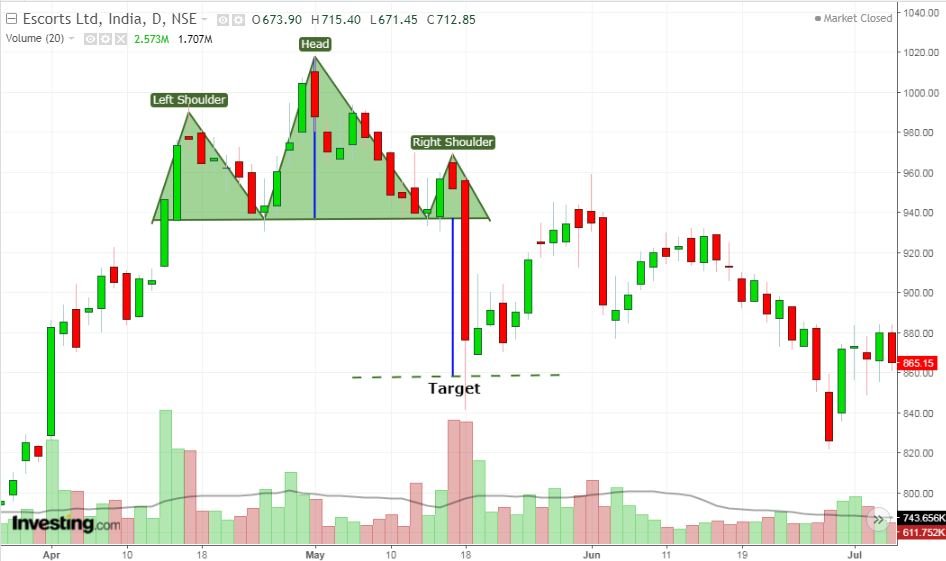
Head and Shoulders (H&S): Up-trend → left shoulder high → head higher → right shoulder similar to left → neckline drawn between two lows → break down = trend reversal.
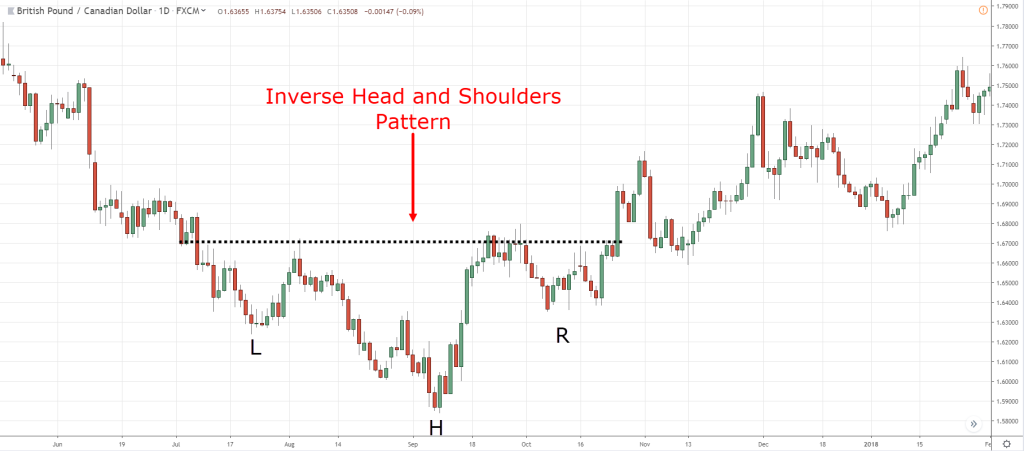
Inverse H&S: Down-trend reversed: left shoulder low → head lower → right shoulder low → breakout above neckline signals up-trend.
How to trade it:
Wait for neckline break with volume.
Entry at break or after pullback to neckline (if you’re patient).
Stop-loss just beyond the right shoulder.
Target = head to neckline height projected beyond breakout.
Nuance: The shoulders don’t have to be exactly equal in height; symmetry helps the pattern’s strength. Volume in the breakout leg should matter.
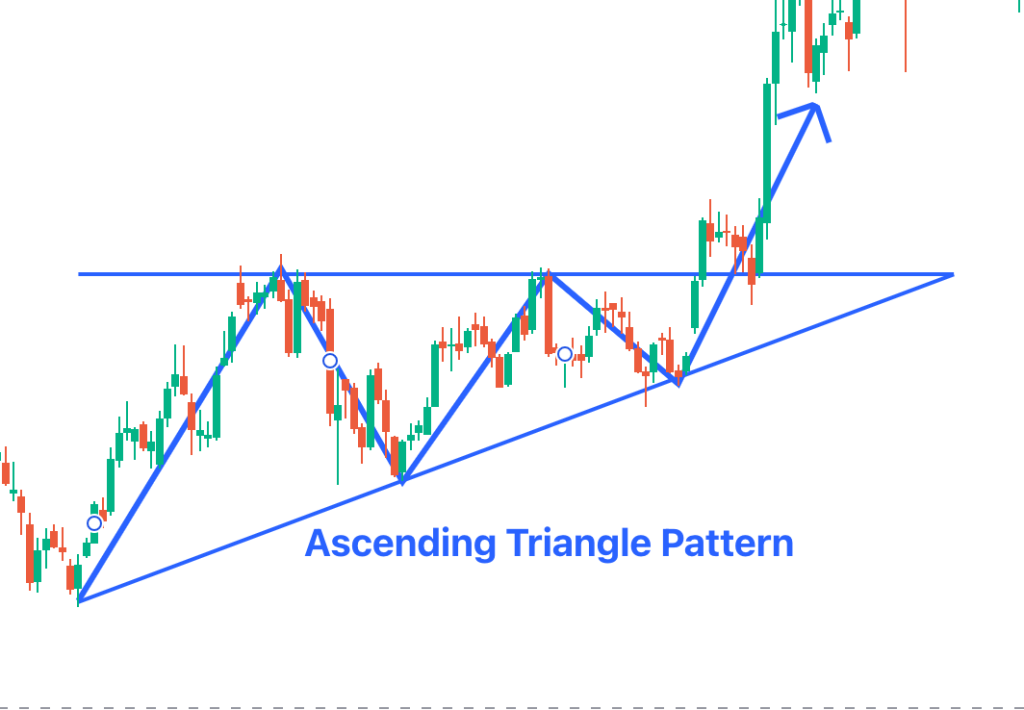
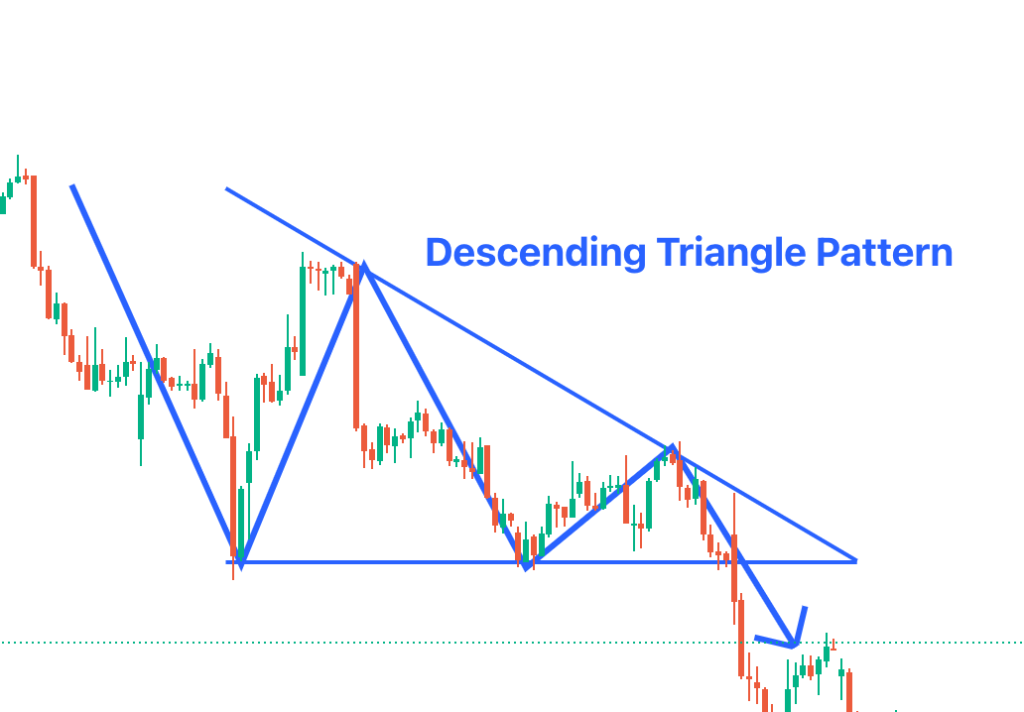
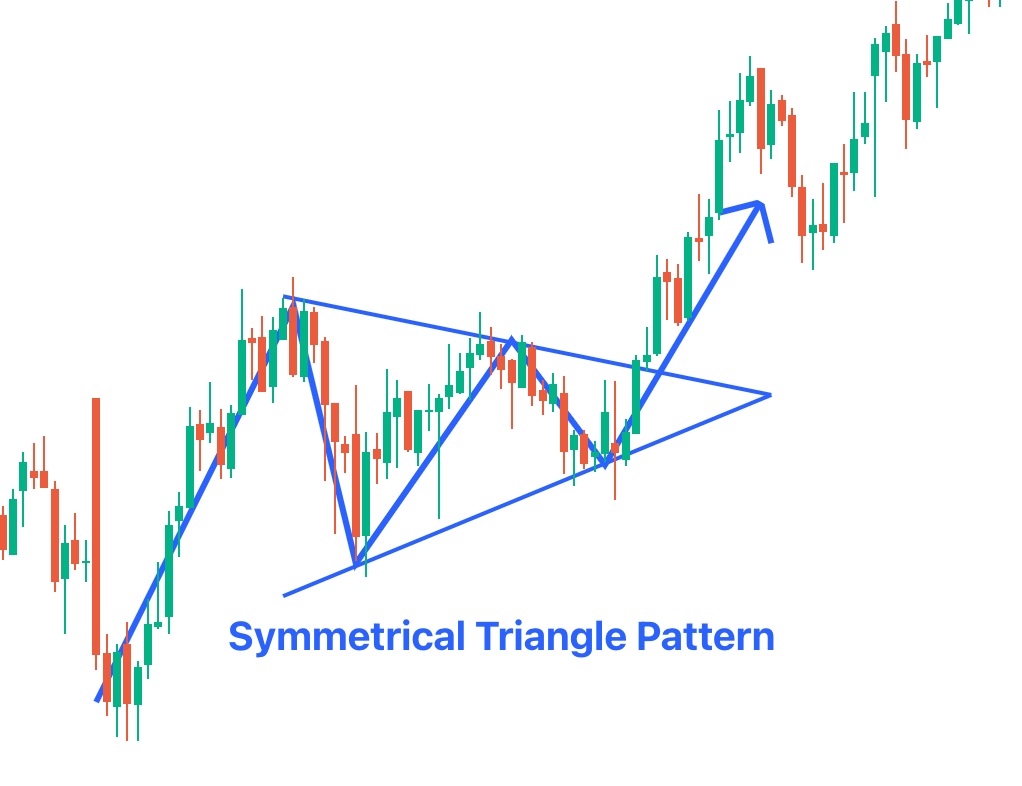
3. Symmetrical Triangle / Ascending Triangle / Descending Triangle
What it is:
Symmetrical Triangle: two converging trend-lines (upper slope down, lower slope up) → period of consolidation → breakout either way.
Ascending Triangle: flat resistance at top + rising support line → bullish bias.
Descending Triangle: flat support + descending resistance line → bearish bias.
How to trade it:
Identify the triangle early; wait for breakout above or below.
Volume should decrease during consolidation and should pick up at breakout.
Entry at breakout (or slight pull-back after breakout).
Stop-loss just inside the triangle pattern (e.g., below breakout for bullish).
Target = widest part of triangle projected from breakout point.
Nuance: Since direction is uncertain in symmetrical triangles, you can hedge or wait for confirmed breakout rather than guess. Ascending/descending make bias stronger; better entry.
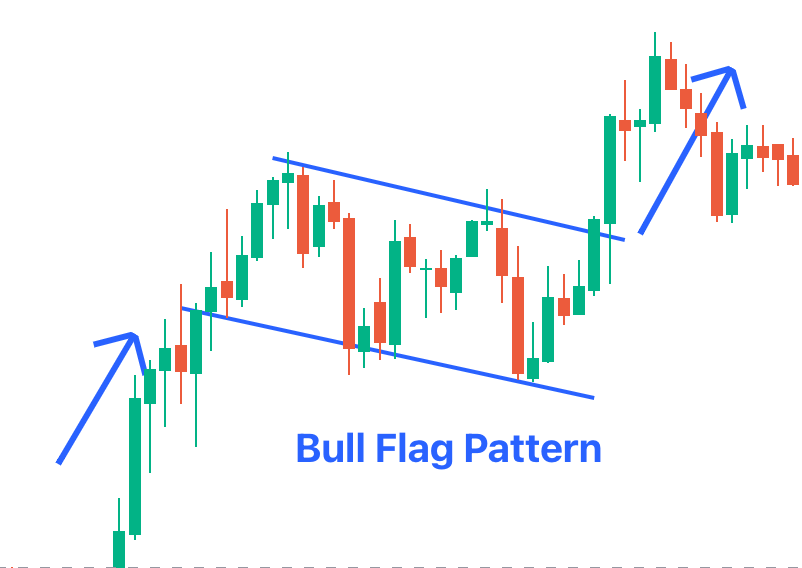
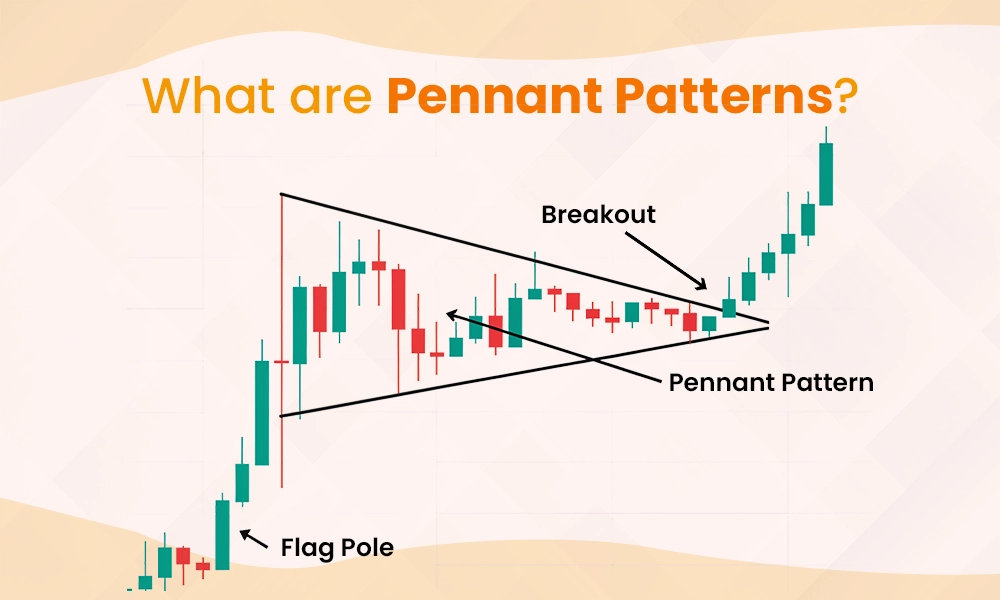
4. Flag and Pennant (Continuation Patterns)
What it is:
After a sharp directional move (flagpole), price pauses in a tight sideways or slightly against-trend range («flag» or «pennant») → then the move resumes in same direction.
Flags look like small rectangles/parallel lines; pennants look like small symmetrical triangles.
How to trade it:
Identify the sharp move.
Identify consolidation range (should have decreasing volume).
Wait for breakout in direction of prior move with volume expansion.
Entry on breakout or slight retest.
Stop-loss just below the consolidation range (for bullish continuation).
Target = measure flagpole height projected from breakout point.
Nuance: The longer the consolidation with tight range + lower volume, the stronger the breakout may be—but also risk of false break. Use volume filters.
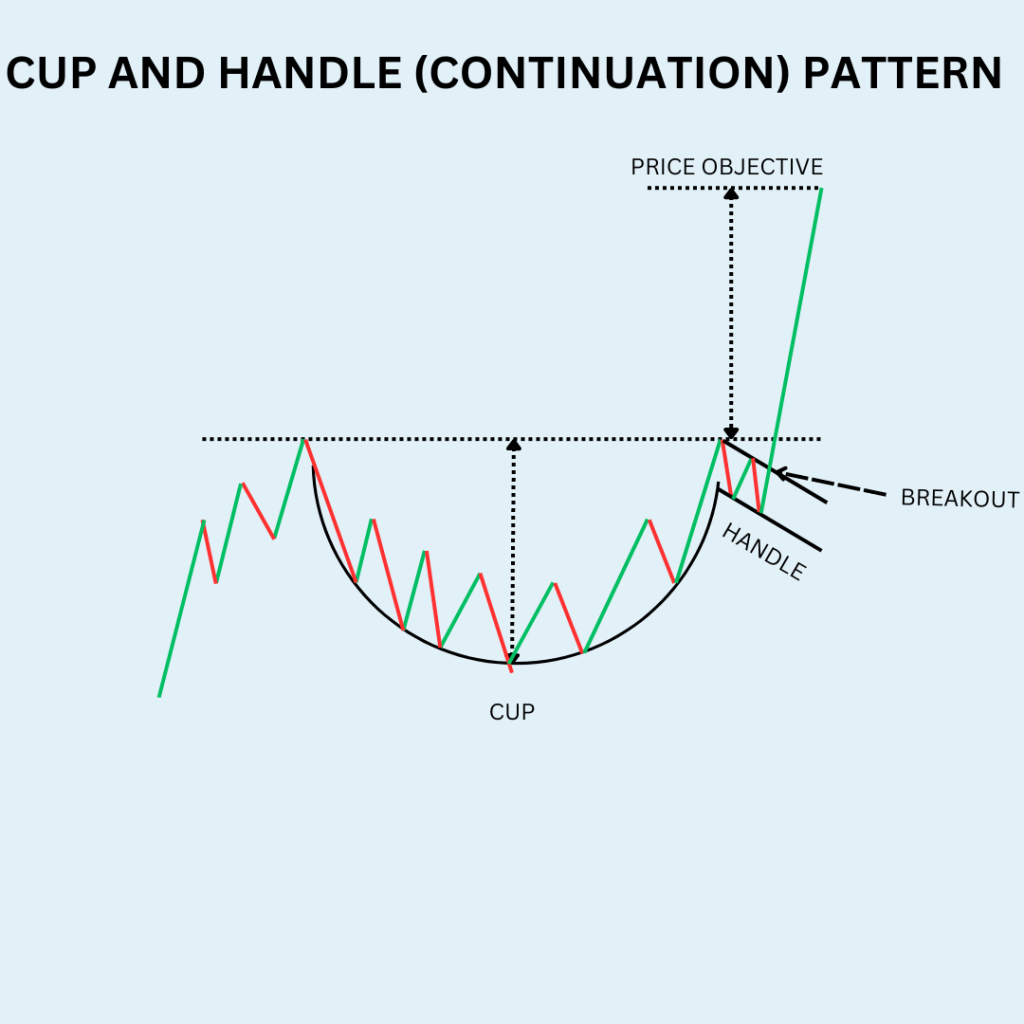
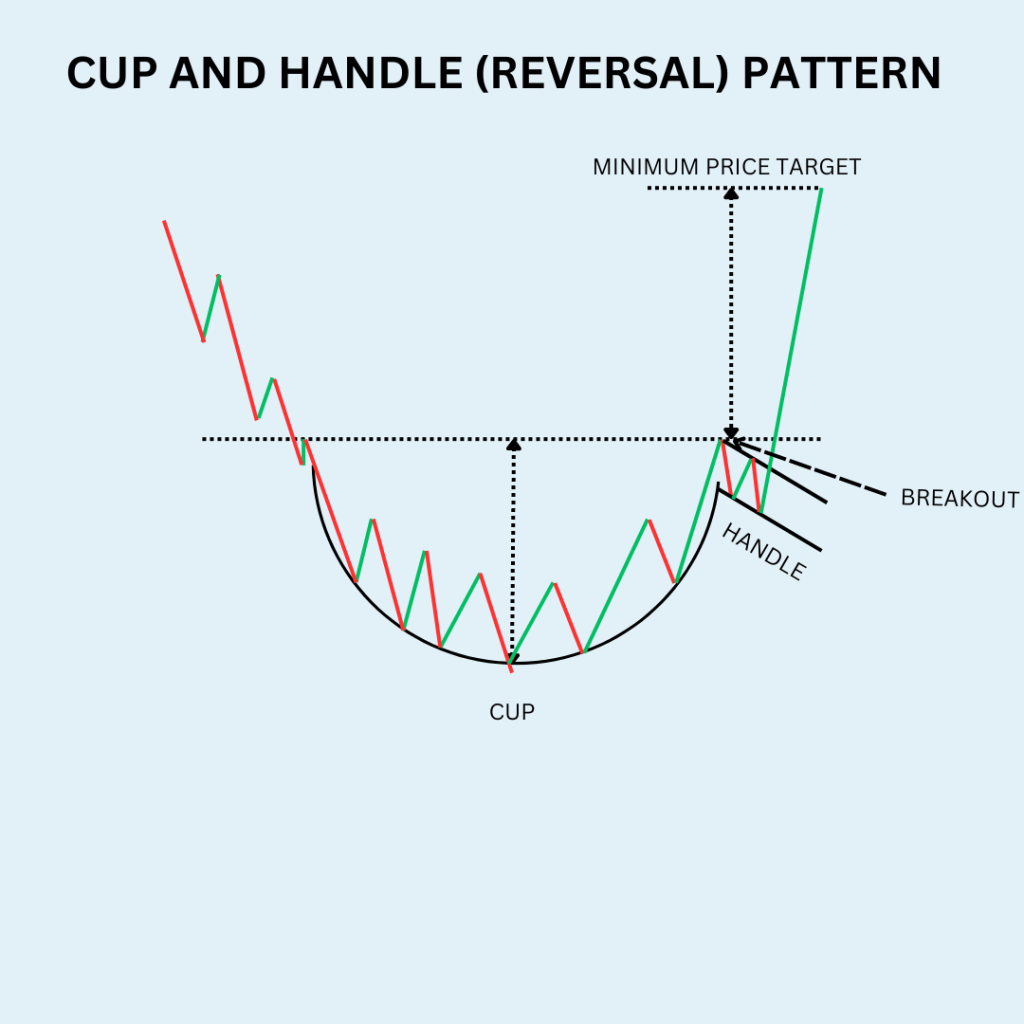
5. Cup and Handle
What it is:
The pattern resembles a “U” shaped cup followed by a smaller handle (a shallow pull-back) → breakout above the rim of the cup signals continuation.
How to trade it:
Cup should form after a trend-up, execute a rounding bottom.
Handle forms as a minor consolidation / pull-back on right side of cup.
Entry at breakout above the cup rim (resistance).
Stop-loss under the handle low.
Target = depth of cup (rim to bottom) projected upward.
Nuance: The cup needs to be rounded (not a sharp “V”). Handle should be shorter in depth (~⅓ of cup) and ideally volume contracts in handle then expands at breakout.
Putting It All Together: Step-by-Step Action Plan
Here’s a step-by-step workflow you can adopt to apply these chart patterns in your trading strategy:
Scan your universe: Use screener tools to spot potential patterns.
Identify pattern correctly: Must meet criteria (for example triangle has at least two touches on each trendline). Use daily charts (and maybe 4-hour or weekly for longer term). Read more on technical chart patterns for trading.
Check volume & context: Is volume decreasing during consolidation? Is there a sector/market backdrop that supports breakout?
Mark your breakout/breakdown level: Draw your neckline, rim, trendlines, etc.
Plan the trade:
Entry: price closing above/below breakout level (or on retest)
Stop-loss: next logical invalidation (often just inside the pattern)
Target: based on pattern geometry or some preferred formula
Risk-reward: Ensure at least 1:2 (or your preferred risk-reward) before placing trade.
Execute: When breakout happens, entry triggered. If retest occurs, and price holds support/resistance, consider entry.
Manage the trade:
Move stop-loss to breakeven once trade moves in your favor.
Do not increase size just because you like the pattern—respect risk.
Adjust target or exit partially if momentum slows or news changes.
Review & learn: After trade ends (target hit, stop hit, or you exit manually), record what worked/what didn’t (volume, entry timing, pattern quality).